In the first part of the series, we left off talking about ways to drive traffic back to your site a second time, third time, and preferably as often as possible. Today we’re returning to the Audience Overview page to talk about some more features of Google Analytics and the helpful information anyone can benefit from.
Besides the New vs. Returning Visitor graphs and monthly minimum sessions, other data on this page to look at would be Average Time on Site, Bounce Rate, and Pages per Session (basically how many pages they visited while checking out your website.) Again, you can’t always just look at these numbers and draw immediate conclusions without first thinking about your marketing strategy.

Developing Your Marketing Strategy
Now, I’ve mentioned having a marketing strategy, but I haven’t really painted a good picture of what that could be. So let me give you a prime example.
Remember in the first post when I said there was a campaign where we actually wanted to decrease time on site and number of pages per session? You see, we were pushing landing pages pretty hard and really trying to get our cost per lead down. Instead, what we found were people (who we were driving to the site with Pay-Per-Click) using the site as a resource. They would go to our amazing landing page but then see all the other great resources on the site and jump to other pages via the menu. Time on site was great and number of pages per session was awesome – but the problem was that they weren’t registering on the landing page. So you know what we did? We removed the menu from the landing page so they didn’t have any other place to go! We wanted them to look at homes, get hit with that registration form, and then sign up. And it worked! Leads went up, cost per lead went down. The average time on site also went down, but that was okay because it’s exactly what we wanted. We got their lead info and knew we could bring them back to the site later using the strategies listed above.
This doesn’t always work. For organic site traffic not tied to a specific campaign, increasing time on site should be a consideration. And we have methods for that purpose as well. Some suggestions are:
 Compelling Blog Content
Linda Craft runs a blog on her site with all kinds of relevant information about local resources, advice, and statistics for buyers and sellers in her Raleigh area.
 Unique Property Searches
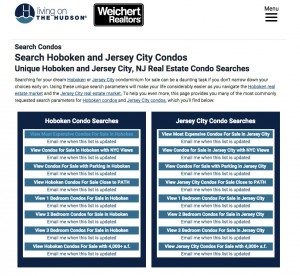
Walter Burns in New Jersey has built a compelling site to match potential clients from all over the world to their perfect property. Living on the Hudson has its perks!
http://www.livingonthehudson.com/unique-condo-search-options
 Thomas & Company uses a simple and beautiful tool to help buyers search for properties by features. It’s a great way to find a property you’d love along with cool perks around it.
http://www.newalbanyohio.com/new-albany-oh-homes-for-sale-by-features
These are a few examples, but other content ideas could include sold data, market statistics, real estate videos, and a whole lot more.

This brings up another great feature of Google Analytics. Often what you are really looking for is trends and how visitors react to various changes in your marketing strategies. So Google Analytics has a great tool for that. It’s called “Annotations.” It’s basically a way to make a note of changes in design or marketing strategies. After all, if you suddenly see a spike in traffic or time on site, you want to easily see where the change resulted.
Using Analytics to Brag
Let’s talk about using Google Analytics to give you some brag numbers. I want to show you how you can mold your stats to give you some great numbers for your marketing materials or listing presentation.

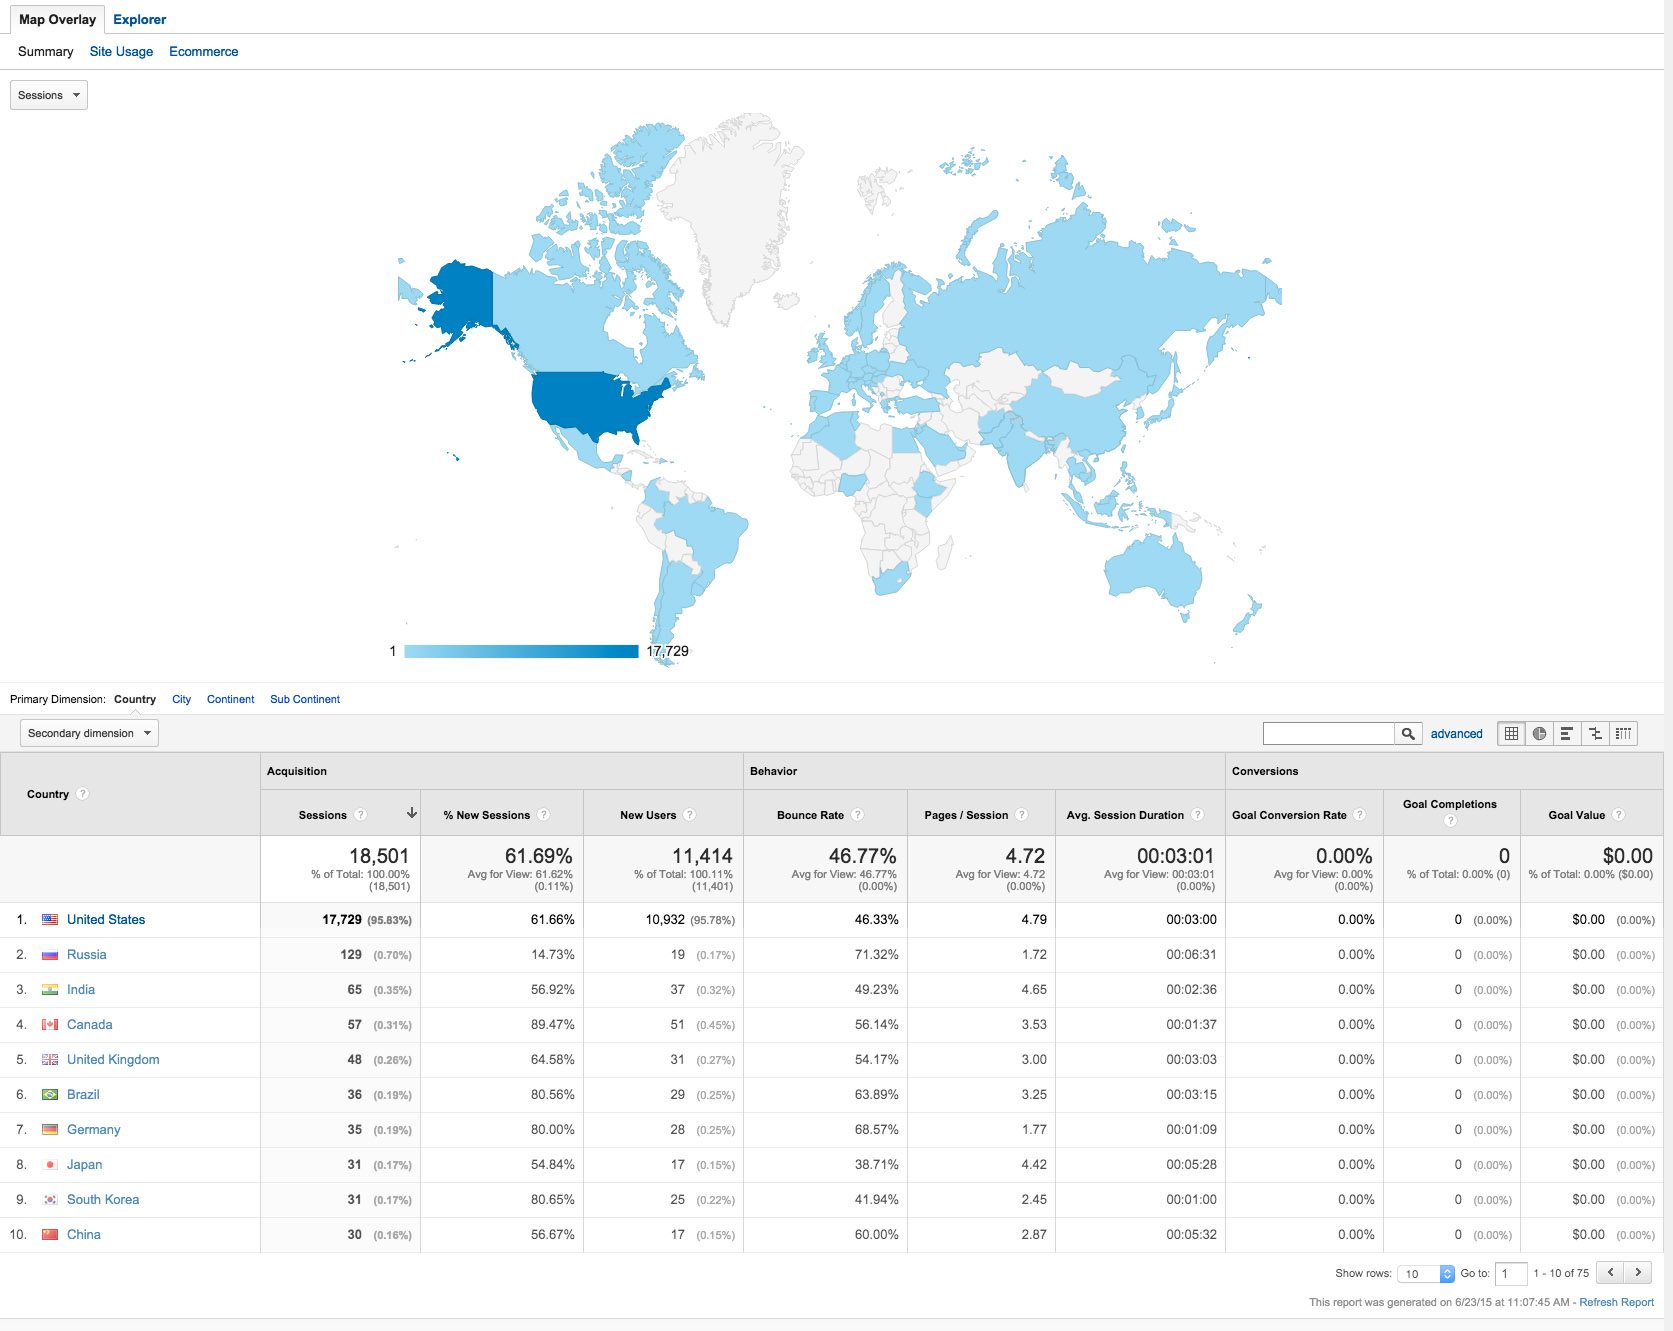
The first thing you are going to want to do is to adjust your date filtering to show as much data as possible. Then click on Audience > Geo > Location. This is going to show you where your traffic is coming from, including countries. This is great if you are in a luxury market and attract buyers from overseas. For example, this client receives traffic from over 150 different countries and all 50 states. This shows sellers that you have a global reach and can market their home to a much bigger audience than most other agents.
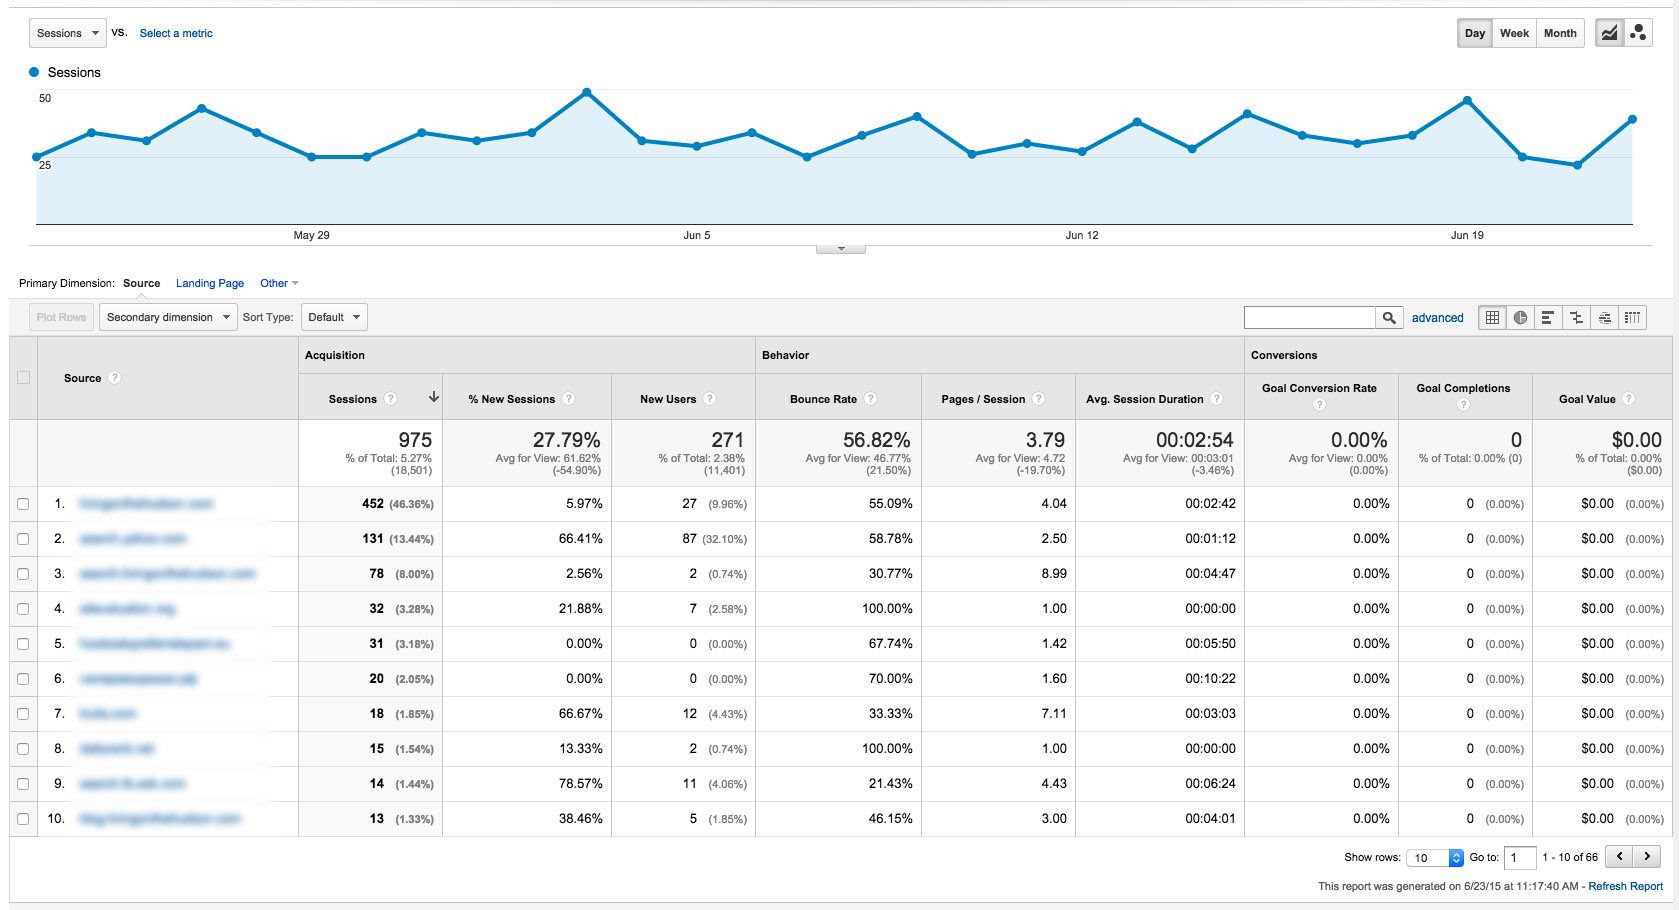
Next, go to Acquisition > All Traffic > Referrals. Here you can see we’ve received traffic from thousands of different websites. We could turn all this data into a marketing message that says our current marketing network consist of over 1,930 sites. It’s all really helpful information you can use to your advantage.

Top pages may not be what you think they are. For example, think about pages as groups. This is all about leverage. For example, take the condo pages. If you add up all the page views of all your condo pages, they would probably greatly outnumber your home page or a call to action landing page. This means that tweaking your condo page updates 50 pages (since all the condo pages basically have the same structure). Perfecting your condo page can have a huge impact across your entire site.

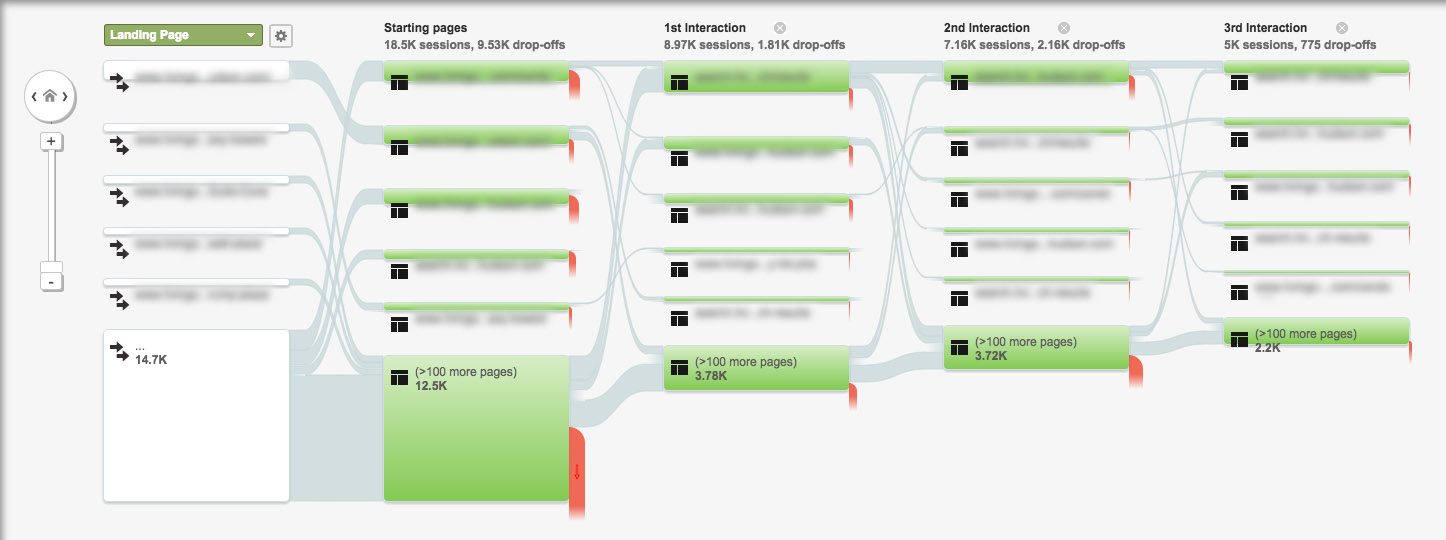
Also available to you are navigational summaries: Where will the visitor click next? On or off the site? To your blog or to your contact page? Do they browse properties or snipe? Very helpful for deciding if content isn’t worth keeping, or maximizing your buttons and links for optimal click-through rates.
Use Analytics, Love Analytics
Google Analytics is a key tool for website owners interested in growing their market and increasing leads and returns. I can’t stress enough how important it is to optimize your site for Analytics reports. Thankfully, Dakno’s services come with Analytics support integrated, and our support team are specialists with decades of experience. Still, I encourage you to visit your report and discover the amazing amount of information you can learn about your clients, your business, and you.
 your other subscriptions


